Linux Logs and Basic Log Analysis
Student Vocation Cybersecurity Learning Series — Lesson 15 of 30
Welcome to Lesson 15 of the Student Vocation Cybersecurity Learning Series!
In Lesson 14, you learned how to inspect running processes, monitor system resources, and check the status of Linux services. Now we will learn how to examine the records those systems and applications produce.
Whenever a computer performs an operation, an application encounters an error, or a service records an event, information about that activity may be written to a log.
For cybersecurity professionals, logs can provide valuable evidence about system activity. They help administrators troubleshoot problems, investigate unusual events, and understand what happened before, during, or after an incident.
In this lesson, you will learn how Linux logs work, where to find common log files, how to read log entries, and how to perform a safe introductory log-analysis exercise.
By the end of this lesson, you should be able to:
- Explain system logs and application logs.
- Identify common Linux log locations.
- Understand the role of journalctl.
- Read logs using less, head, tail, and grep.
- Interpret timestamps and log severity.
- Search sample logs for important events.
- Explain why a single log entry does not necessarily prove a security incident.
-
What Are Linux Logs?
A log is a record of an event or activity generated by an operating system, service, or application.
Depending on the system, logs may record:
- System startup and shutdown events.
- Service starts, stops, and failures.
- Authentication successes and failures.
- Application errors and warnings.
- Network-related events.
- Scheduled tasks.
- Security-related activity.
- Changes or operations performed by software.
Logs may be stored as text files, collected by a logging service, or kept in a structured format that can be queried with specialised tools.
Not every action on a computer is necessarily logged. The amount of information recorded depends on the operating system, application, logging configuration, permissions, and retention settings.
Why are logs important in cybersecurity?
Logs help security professionals answer questions such as:
- When did a service fail?
- Did an application record an error?
- Were there repeated authentication failures?
- What events occurred before an unexpected restart?
- Does an observed event match normal system activity?
- Are several related events occurring within a suspicious time window?
Logs are evidence, not automatic conclusions. An unfamiliar event or failed login may have a legitimate explanation. Good analysis considers context, corroborating evidence, and the system’s normal behaviour.
-
Understanding System Logs and Application Logs
Linux logs can be grouped by their purpose, although logging arrangements differ between distributions and applications.
- System logs
System logs record events associated with the operating system and its services.
Examples include:
- Boot messages.
- Kernel messages.
- Service errors.
- Hardware-related warnings.
- System-level authentication activity, where configured.
These records help administrators understand system behaviour and troubleshoot operational issues.
2. Application logs
Application logs are produced by individual applications or software services.
Examples include:
- A web server recording HTTP requests and errors.
- A database recording startup messages or failed operations.
- An application recording a failed connection.
- A program recording an unexpected exception.
Application logs can be particularly useful when an issue affects one service rather than the whole operating system.
3. Security and authentication logs
Some logs record authentication and security-related events, such as login attempts, account activity, or access-control decisions.
The precise location and content vary by Linux distribution and authentication configuration.
For example, some Debian- or Ubuntu-based systems use /var/log/auth.log, while some Red Hat-based systems commonly use /var/log/secure. Other systems may rely on the system journal, a separate logging service, or a central logging platform.
Do not assume that every Linux computer records the same events in the same files.
-
Common Linux Log Locations
Many Linux distributions use directories under /var/log for log files, although some rely heavily on the system journal.
Here are common examples:
Location |
Typical purpose |
| /var/log/syslog | General system messages on some Debian- or Ubuntu-based systems |
| /var/log/messages | General system messages on some other distributions |
| /var/log/auth.log | Authentication-related messages on some Debian- or Ubuntu-based systems |
| /var/log/secure | Authentication and security messages on some Red Hat-based systems |
| /var/log/kern.log | Kernel messages on some systems |
| /var/log/dpkg.log | Package-management activity on Debian-based systems using dpkg |
| /var/log/ | Directory that commonly contains system and application logs |
These are examples, not a universal list. A particular file may be absent, empty, rotated, or inaccessible to an ordinary user.
What is log rotation?
Logs can grow over time. To control storage usage, systems may rotate them.
Log rotation commonly means moving the current log aside, creating a new log file, and retaining older logs under different names. Older logs may also be compressed or eventually removed according to retention policies.
For example, a directory may contain:
- application.log
- application.log.1
- application.log.2.gz
The exact naming scheme depends on the logging software and its configuration.
When investigating an event, remember that older entries may have been rotated into separate files or removed after a retention period.
Important access reminder
Some log files contain private information, usernames, IP addresses, or other sensitive data. Only inspect logs on systems you own or are explicitly authorised to administer. Do not share sensitive log contents publicly.
-
What Is systemd and the System Journal?
Many modern Linux distributions use systemd to initialise and manage system services.
One component of this environment is systemd-journald, a service that collects and stores system and service messages in the system journal.
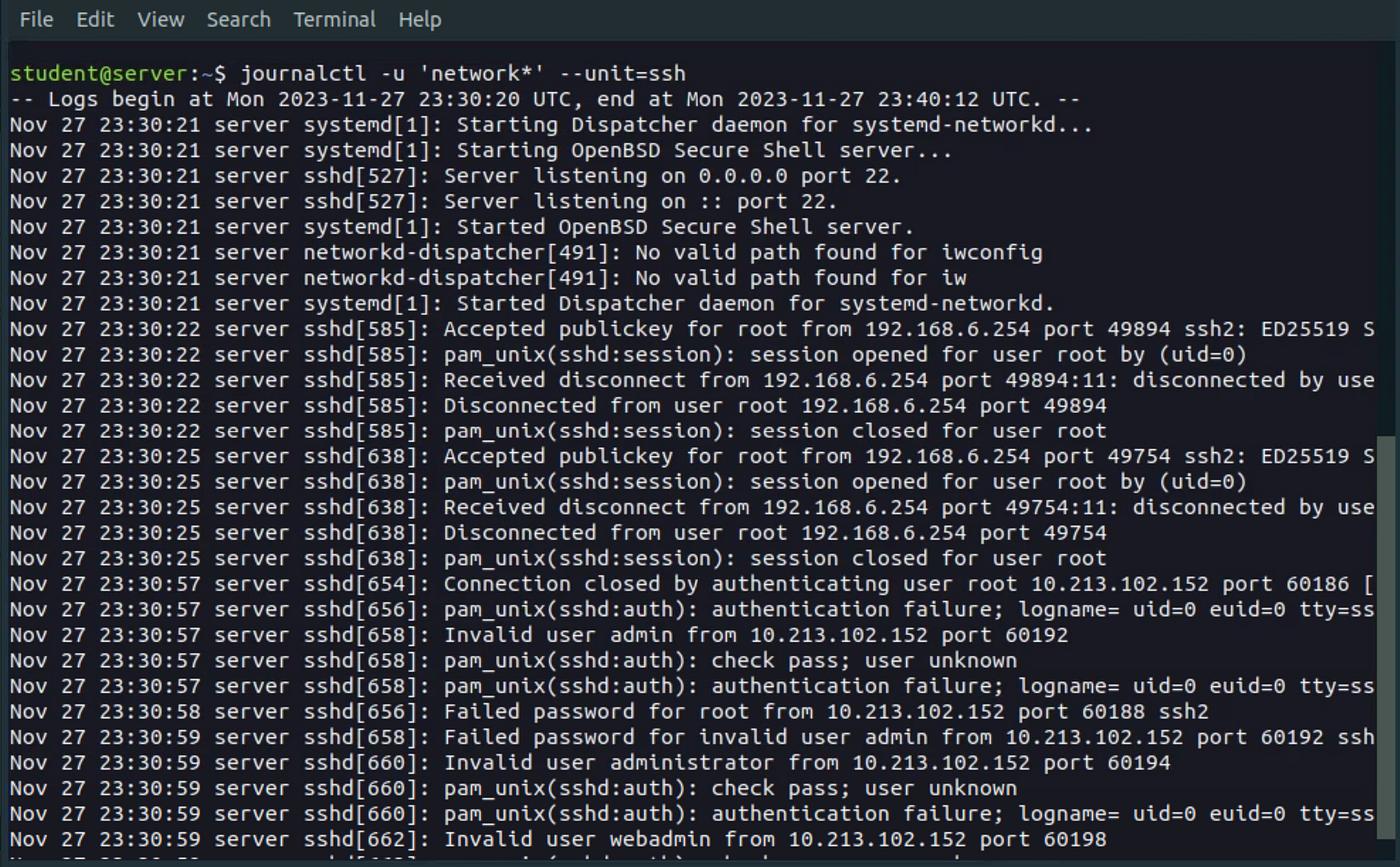
On systems where it is available, the journalctl command allows users to query that journal.
Journal entries can contain information such as:
- A timestamp.
- The system or service that generated the message.
- The process ID, where applicable.
- The message text.
- Additional structured metadata.
Journal storage can be persistent or volatile, depending on system configuration. Some environments do not use systemd at all.
-
Using journalctl to Read System Logs
The journalctl command is one of the most useful tools for inspecting logs on systems that use the systemd journal.
- View journal entries
Run:
journalctl
This requests journal entries that the current user is permitted to read. On a busy system, there may be a large amount of output.
2. Display recent entries
Run:
journalctl -n 20
This requests the most recent 20 journal entries available to the command.
The number is a limit on the entries displayed, not a count of security incidents.
3. View entries from the current boot
Run:
journalctl -b
This requests journal entries from the current boot.
It can help you investigate recent startup activity and events that occurred since the current system session began.
4. Inspect messages from a particular service
On a systemd system, you can query a service’s journal entries with:
journalctl -u UNIT_NAME
Replace UNIT_NAME with the actual service unit name.
For example, if the relevant unit is cron, you could run:
journalctl -u cron
The unit name varies by distribution. The command may return no entries if the service is absent, has not produced relevant messages, or access is restricted.
5. Limit output to a time window
For example:
journalctl –since “1 hour ago”
This requests journal entries since the specified relative time.
You can also use a date and time supported by the command’s time parser, such as:
journalctl –since “2026-10-28 09:00:00”
Use an appropriate date for your investigation and consider the system’s time zone.
6. What if journalctl is unavailable?
Some containers, lightweight Linux installations, and WSL environments do not run systemd. In these environments, journalctl may be missing or unable to connect to a journal.
That does not automatically mean Linux is malfunctioning. Use the log files and tools available in your environment, and consult the documentation for your distribution.
For this lesson, you can complete the practical lab using a sample text file without accessing any real system logs.
-
Using less to Read Log Files
Log files can contain hundreds or thousands of lines. The less command allows you to inspect a text file without printing the entire file to the terminal at once.
Example:
less /var/log/syslog
This works only if that file exists and your account has permission to read it.
Within the viewer, common actions include:
- Moving through the file.
- Searching for a word or phrase using /.
- Moving to the next match with n in standard less usage.
- Exiting with q.
For example, while viewing a file, type:
/error
Then press Enter to search for that term. Use n to move to another match.
The exact keys available may depend on the viewer and its configuration.
-
Using head and tail
The head and tail commands help you inspect a selected portion of a text file.
- head — View the beginning
Example:
head -n 10 sample.log
This displays the first ten lines of sample.log.
It can be useful when checking the format of a file or reviewing its earliest entries.
2. tail — View the end
Example:
tail -n 10 sample.log
This displays the last ten lines of the file.
Because some logs append new entries over time, tail is useful when examining recent activity.
3. Follow a changing log
The command:
tail -f sample.log
continues displaying new lines appended to the file while the command is running.
This is a monitoring operation rather than a one-time snapshot. Press Ctrl+C to stop following the file in a typical terminal.
For the main practical lab, use head and tail without -f so you can work with a fixed sample file.
-
Using grep to Search Log Entries
The grep command searches text for matching patterns.
Suppose a sample log contains:
2026-10-28 09:00:00 INFO Application started
2026-10-28 09:02:11 WARNING Retry scheduled
2026-10-28 09:03:45 ERROR Database connection failed
To search for entries containing ERROR, run:
grep ‘ERROR’ sample.log
To include line numbers:
grep -n ‘ERROR’ sample.log
To search without distinguishing uppercase and lowercase:
grep -i ‘error’ sample.log
To search for several terms using an extended regular expression:
grep -E ‘ERROR|WARNING’ sample.log
These commands display matching lines; they do not automatically determine the cause of the event.
Searching real logs carefully
A command such as:
grep -i ‘failed’ sample.log
can help locate lines containing the word failed.
However, a search term may appear in a message that is unrelated to an incident, and a security event may be recorded using different wording. Search results should be interpreted in context.
Avoid treating every match as a confirmed attack.
-
How to Interpret Log Timestamps
A timestamp records when a log entry was generated or recorded according to the logging system.
Consider this example:
2026-10-28 09:03:45 ERROR Database connection failed
The timestamp can be separated into:
- Date: 2026-10-28
- Time: 09:03:45
- Severity or level: ERROR
- Message: Database connection failed
This allows an analyst to place the event within a timeline.
1. Why timestamps matter
Timestamps help you:
- Establish the sequence of events.
- Compare events across applications.
- Identify how close together repeated failures occurred.
- Determine whether an error happened before or after a service restart.
- Correlate events from multiple systems.
2. Understand time zones
Not all logs display timestamps in the same time zone or format.
Some entries use local system time. Others use UTC or include an explicit time-zone offset. Certain formats may omit the time zone entirely.
Before comparing logs from different systems, verify the time zone and timestamp format. Otherwise, events can appear out of order even when their underlying timestamps are valid.
3. Time configuration can affect investigations
Incorrect system clocks, delayed event delivery, and differences in time zones can complicate analysis.
Do not assume that the order in which entries appear is always sufficient to establish the exact sequence of events across multiple machines.
4. What are log severity levels?
Applications and logging systems often use severity labels such as:
- DEBUG — detailed information useful for troubleshooting.
- INFO — ordinary operational information.
- NOTICE — a significant normal event in systems that use this level.
- WARNING — a condition that may need attention.
- ERROR — an operation or component encountered a problem.
- CRITICAL, ALERT, or EMERGENCY — higher-severity conditions in systems that use these levels.
Not every application uses every level, and the exact labels vary.
An ERROR entry does not automatically mean a cybersecurity incident. A routine application failure may produce an error. Likewise, the absence of an error message does not prove that a system is secure.
-
A Simple Log-Analysis Method
When you first examine a log, use a repeatable approach.
Step 1: Identify the source
Determine which system, service, or application produced the log.
A web server log has a different purpose from a kernel log or authentication log.
Step 2: Identify the time window
Record the relevant date, time, and time zone.
If you are investigating an incident, use the available evidence to define a reasonable time window rather than searching randomly.
Step 3: Search for relevant events
Use suitable keywords, such as ERROR, failed, timeout, or a known service name.
Do not rely on only one keyword. Different applications use different message formats.
Step 4: Compare related entries
Look for events immediately before and after the relevant message.
For example, a connection error may be preceded by a service restart or followed by a successful retry.
Step 5: Separate observations from conclusions
An observation might be:
“Three failed sign-in events were recorded within two minutes.”
A conclusion would require more evidence:
“These events represent an unauthorised attempt to access the account.”
The second statement requires context, such as the source of the attempts, expected user activity, and other available records.
Step 6: Record your findings
Document the source, relevant timestamps, matching entries, and any uncertainties.
During a real investigation, preserve evidence according to your organisation’s procedures. Do not alter or delete logs to make an investigation easier.
-
Safe Practical Linux Lab: Analyse a Sample Log
Lab title: Search, Filter, and Interpret Linux-Style Log Entries
Objective: Practise reading log text, searching for error and warning messages, and constructing a simple event timeline.
Required environment: Your own Linux computer, an authorised WSL environment, or a Linux virtual machine you are permitted to use.
Safety rules:
- Work only inside your own practice directory.
- Use the sample log created in this exercise.
- Do not change or delete real system logs.
- Do not use sudo.
- Do not access another user’s private logs without authorisation.
- Remember that the timestamps and events in the sample are fictional training data.
Step 1: Create a practice directory
Run these commands one at a time:
cd ~
mkdir -p log-analysis-lab
cd log-analysis-lab
pwd
Check that the displayed path ends in your log-analysis-lab directory.
Step 2: Create a harmless sample log
Run:
printf ‘%s\n’ \
‘2026-10-28 09:00:00 INFO Application started’ \
‘2026-10-28 09:01:12 INFO User session opened’ \
‘2026-10-28 09:02:11 WARNING Retry scheduled’ \
‘2026-10-28 09:03:45 ERROR Database connection failed’ \
‘2026-10-28 09:04:02 INFO Connection retry started’ \
‘2026-10-28 09:04:10 INFO Database connection restored’ \
‘2026-10-28 09:05:30 INFO Application operating normally’ \
> sample.log
This creates sample.log with eight fictional entries. If a file with this name already exists, the > redirection replaces its contents. Use this command only if you do not need to preserve an existing file in your practice directory.
Step 3: Read the beginning of the log
Run:
head -n 3 sample.log
You should see the first three entries.
Question: What happened at the beginning of the recorded sequence?
Step 4: Read the latest entries in the sample
Run:
tail -n 3 sample.log
This displays the final three lines in the file.
Question: What does the last recorded entry say about the application?
Step 5: Search for errors
Run:
grep -n ‘ERROR’ sample.log
This finds lines containing ERROR and displays their line numbers.
You should find the entry reporting that the database connection failed.
Step 6: Search for warnings and errors
Run:
grep -E ‘WARNING|ERROR’ sample.log
This displays entries containing either WARNING or ERROR.
Question: How many entries match these two severity labels in the sample?
Step 7: Open the file with less
Run:
less sample.log
Practise moving through the file. Search for Database by typing /Database and pressing Enter.
Press q to exit.
If less is unavailable, you can continue using head, tail, and grep for the remaining steps.
Step 8: Construct a basic timeline
Use the output to record the following:
- When did the application start?
- When was the warning recorded?
- When did the database connection fail?
- When was the connection restored?
- How much time passed between the failure at 09:03:45 and the restoration at 09:04:10?
For the last question, calculate the difference using the displayed timestamps.
Step 9: Write your analysis
Write a short paragraph answering:
- What happened in the sample?
- Which entries support your explanation?
- Does the sample alone prove that a cyberattack occurred?
- What additional information would you want before making a security conclusion?
Expected interpretation: The sample shows a warning, a database connection failure, a retry, and a later successful connection. These entries suggest a temporary connection problem, but they do not establish its underlying cause.
Lab success criteria
You have completed the lab when you can:
- Create and inspect a sample log file.
- Display the beginning and end of a log.
- Search for selected severity labels.
- Use less to navigate text where available.
- Interpret timestamps and order events.
- Separate recorded observations from assumptions.
Explain why logs are useful in troubleshooting and cybersecurity
PREVIOUS LESSON | NEXT LESSON