Linux Processes, Services and System Monitoring
Student Vocation Cybersecurity Learning Series — Lesson 14 of 30
Welcome to Lesson 14 of the Student Vocation Cybersecurity Learning Series!
In Lesson 13, we explored Linux file permissions, user accounts, groups, and the principle of least privilege. In this lesson, we will learn how to observe programs running on a Linux computer and check whether the system is operating normally.
Every time you open a terminal, run a command, launch an application, or start a background service, Linux manages work through processes.
Learning to inspect these processes and monitor system resources is an important step towards becoming a capable cybersecurity student.
By the end of this lesson, you should be able to:
- Explain processes and process IDs.
- Distinguish foreground jobs, background jobs, and services.
- Inspect running processes with ps and top.
- Check memory usage with free.
- View system uptime and load averages.
- Inspect services with systemctl status where available.
- Recognise why monitoring matters in defensive cybersecurity.
- Complete a safe monitoring lab using read-only commands.
-
What Is a Linux Process?
A process is an instance of a program being executed by the operating system.
When you run a command such as:
whoami
Linux starts or uses the relevant command execution process, which prints the effective username.
Other examples of processes include:
- A web browser running on your computer.
- A text editor you have opened.
- A script processing a file.
- A program that handles network requests.
- A background application performing scheduled work.
Linux manages the resources processes need, including processor time, memory, and access to files or other system resources, subject to permissions and system controls.
A process is not necessarily the same as a program file. A program is stored instructions; a process is a running instance of those instructions.
A single program can have multiple running processes, and some processes can create child processes to perform additional tasks.
-
What Is a Process ID (PID)?
A Process ID, commonly abbreviated as PID, is a numeric identifier Linux assigns to a process.
PIDs help administrators distinguish one running process from another.
For example, a process listing might contain:
PID COMMAND
1420 bash
1856 python
2031 firefox
These numbers are illustrative examples, not live processes from your computer.
In this example, 1420, 1856, and 2031 identify individual processes at the time of the listing.
PIDs may change when programs restart, and a PID can eventually be reused. Do not assume that a PID will always refer to the same program over time.
Why are PIDs useful?
PIDs help you:
- Identify a process.
- Check which user owns a process.
- Inspect resource usage.
- Investigate unexpected system activity.
- Understand parent-child process relationships.
- Troubleshoot applications that are not responding.
A PID alone does not establish whether a process is safe or malicious. You need context, such as the executable path, user, command arguments, resource usage, and expected system behaviour.
-
What Is a Foreground Process?
A foreground process runs interactively in the terminal and normally occupies that terminal until it finishes or is interrupted.
For example:
top
This opens an interactive system-monitoring display in the terminal. While it is running, that terminal is being used by top.
On typical Linux implementations, press q to quit the display.
Other commands, such as cat somefile.txt, ordinarily run in the foreground, print their output, and return control to the shell when they finish.
Foreground execution is useful when you want to see the program’s output immediately or interact with it.
-
What Is a Background Process?
A background job allows the shell to start a command without keeping the terminal occupied while that job continues running.
In a typical Bash shell, adding & at the end of a command starts it as a background job.
For example:
some-command &
This is a general syntax illustration, not a command to copy by itself. Replace some-command with an appropriate program you understand.
For a harmless example, you can run:
printf ‘Background job example\n’ > /dev/null &
This sends a short text string to /dev/null, a special device that discards output. The shell may display a job number and a PID.
Useful Bash job-control commands include:
- jobs — lists jobs known to the current shell.
- fg — brings a shell job to the foreground.
- bg — resumes a stopped shell job in the background, where applicable.
These commands concern jobs managed by the current shell. They do not list every process running on the computer.
Important distinction: A background job is not automatically a system service. It may end when its task is complete, whereas a service often runs independently of a user’s interactive shell.
-
What Is a Linux Service?
A service is a program or group of processes that provides a function to a system or other applications, often in the background.
Examples include:
- A web server that responds to website requests.
- A network service that supports communication.
- A scheduled task manager.
- A logging service that records system events.
- A service that manages system connectivity.
Many modern Linux distributions use systemd as their service manager. On such systems, administrators commonly use systemctl to inspect and manage services.
Other Linux environments may use different service managers, and some lightweight containers or Windows Subsystem for Linux (WSL) installations may not run systemd.
Process versus service
Feature |
Process |
Service |
| Meaning | A running instance of a program | A system or application function, often managed in the background |
| Identifier | Commonly has a PID while running | May have a service or unit name |
| Example | A running browser process | A web-server service |
| Management | Process and job-management tools | A service manager where available |
| Monitoring | ps, top | systemctl status on systemd systems, plus process and log tools |
A service usually involves one or more processes, but the terms are not interchangeable.
-
Command 1: ps — Inspect Running Processes
The ps command displays process information.
To inspect processes associated with your current terminal, run:
ps
A common broader snapshot is:
ps aux
On many Linux systems, this shows a wider list of processes and information such as:
- USER — the user associated with the process.
- PID — the process ID.
- %CPU — a CPU usage measure.
- %MEM — a memory usage measure.
- STAT — process state information.
- COMMAND — the command associated with the process.
The precise columns and their interpretation depend on the implementation and options.
Filter a process listing
To search the output for a particular application name, you might use:
ps aux | grep ‘[s]sh’
This searches the displayed process list for text matching ssh. It is only an illustrative search; it does not establish whether a matching process is expected or safe.
Searching with grep can produce incomplete or misleading results because process names and command arguments vary. For important investigations, use more targeted process-inspection tools and verify the details.
Cybersecurity use: ps provides a snapshot of process activity that can help you investigate unexpected programs or understand resource usage.
-
Command 2: top — Monitor Processes in Real Time
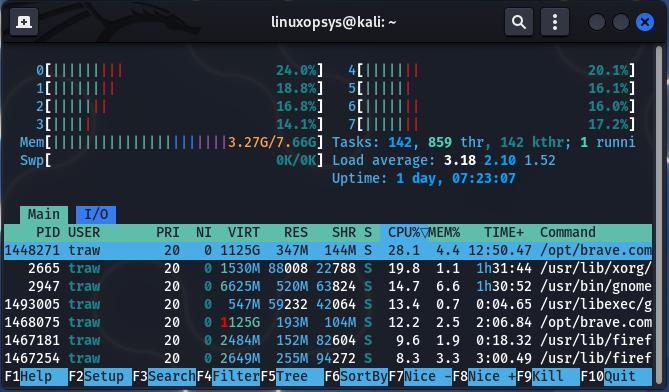
The top command provides an interactive view of running processes and system activity.
Run:
top
Depending on the system, the display can include:
- System uptime.
- Load averages.
- Total and available memory information.
- CPU activity.
- Running and sleeping processes.
- Process IDs and users.
- Per-process resource usage.
Unlike a one-time ps listing, top refreshes its display while it runs.
On standard implementations, press q to exit.
What should you observe?
When learning top, look for:
- The number of tasks or processes.
- Overall CPU activity.
- Memory and swap information.
- Processes consuming relatively high CPU or memory.
- Whether the system remains responsive.
High CPU usage does not automatically mean that a system is compromised. Updates, backups, browser activity, and legitimate computational tasks can all consume substantial resources.
The goal is to learn what is normal for the system before trying to explain unusual behaviour.
-
Command 3: free — Check Memory Usage
Computer memory, commonly called RAM, stores data and instructions that running programs need to access quickly.
Linux uses memory for applications and also for caching data that may be needed again.
Run:
free -h
On Linux systems with the standard free utility, the command reports memory and swap statistics in human-readable units.
Common fields include:
- total — the total amount reported for the relevant memory category.
- used — memory currently counted as used according to the tool’s reporting method.
- free — memory that is currently unused.
- available — an estimate of memory available for starting new applications without swapping.
The available figure is often more useful than looking only at the free figure. Linux may use otherwise idle memory for caching, and that memory can often be reclaimed.
What is swap?
Swap is disk space or another configured storage area used to support memory management when necessary.
Heavy swap activity can affect performance, especially when a system has limited RAM. However, the mere presence of swap usage does not prove a problem.
Cybersecurity use: Monitoring memory can help you identify resource pressure and provide context when investigating an application that is behaving unexpectedly.
-
Command 4: uptime — Check System Uptime and Load
Run:
uptime
This displays information that commonly includes:
- The current time.
- How long the system has been running.
- The number of logged-in users.
- The system load averages.
What is system uptime?
Uptime is the amount of time the system has been running since its most recent boot.
It can help you understand whether a machine has recently restarted.
What is load average?
Load averages summarise system load over recent time periods, commonly one, five, and fifteen minutes.
On Linux, load average accounts for tasks that are runnable and tasks in certain uninterruptible states, not only processes actively using the CPU.
A load average of 2.00 does not mean exactly 2% CPU usage. Whether a given load is high depends partly on the number of available CPU cores and the work the system is performing.
For example, a load average of 4 may be substantial on a single-core machine but less concerning on a system with many cores. Context matters.
-
Command 5: systemctl status — Inspect a Service
On a Linux system that uses systemd, systemctl can display the status of a service.
For example:
systemctl status cron
This requests the status of a service unit named cron on systems where that unit exists. The service name varies by distribution; some systems use crond instead.
Another common example on some Linux distributions is:
systemctl status ssh
The unit may instead be named sshd, depending on the distribution and configuration.
If you do not know the service name, do not guess repeatedly or start changing services. Consult your distribution’s documentation or inspect available unit names using an appropriate read-only command, such as:
systemctl list-units –type=service –all
On a systemd system, status output can include:
- The unit name.
- Whether the unit is loaded.
- Whether the service is active, inactive, or failed.
- The main process ID, when applicable.
- Recent log messages associated with the service.
Some status information may be unavailable to ordinary users, and permissions may limit access to certain details.
Understanding common service states
- Active (running): The service is currently running.
- Inactive (dead): The service is not currently running.
- Failed: The service encountered a failure or ended in a failed state.
- Active (exited): The service’s configured task completed, but its unit remains considered active. This can be normal for certain one-shot units.
An inactive service is not necessarily a fault. It may be intentionally stopped or unnecessary on that system.
What if systemctl is unavailable?
Some WSL environments, containers, or lightweight Linux installations do not run systemd. In those environments, systemctl may report that the system has not been booted with systemd or may not be installed.
This does not automatically mean the system is broken. Use the monitoring tools available in your environment and follow its documentation.
For this beginner lesson, you only need to inspect service status where the command is supported.
-
Why System Monitoring Matters in Cybersecurity
System monitoring helps security professionals understand what a computer is doing and investigate behaviour that may require attention.
- Recognising unexpected resource usage
A program consuming unusually high CPU or memory may be performing a legitimate task, malfunctioning, or doing something suspicious.
Monitoring helps you identify the observation. Additional evidence is needed to determine the cause.
2.Understanding services
A service may be important to normal system operation. Knowing which services are expected helps administrators investigate unfamiliar or unexpected activity.
However, a service name alone is not enough to decide whether it is safe. Verify its origin, executable path, configuration, and expected purpose.
3. Supporting incident investigation
When an incident is suspected, process and service information can help analysts build a picture of what was running at a particular time.
Live process information is temporary. It should be interpreted alongside other evidence, such as system logs, application logs, file metadata, and security monitoring records.
4. Troubleshooting performance
High CPU usage, memory pressure, or a failed service may indicate an ordinary operational problem. Security and reliability often overlap because poorly functioning systems can interfere with normal monitoring and administration.
5. Establishing a baseline
A baseline is an understanding of normal system behaviour.
For example, a training computer might normally run a browser, a terminal, and a few system services. If the machine begins behaving differently, the baseline gives you a starting point for investigation.
Not every change is a security incident. Compare observations with expected system activity before drawing conclusions.
-
Safe Practical Linux Lab: Read-Only System Monitoring
Lab title: Inspect Processes, Memory, Uptime, and Services
Objective: Practise collecting basic system information using commands that do not intentionally modify system configuration.
Required environment: Your own Linux computer, an authorised WSL environment, or a Linux virtual machine you are permitted to use.
Safety rules:
- Monitor only your own authorised environment.
- Do not stop, kill, or restart processes or services during this lab.
- Do not use sudo.
- Do not install software or change system configuration.
- Read command output carefully; your results will differ from the examples.
Step 1: Check uptime
Run:
uptime
Record the approximate uptime and the three load averages if displayed.
Ask yourself: Does the system appear to have been running for minutes, hours, or days?
Step 2: Inspect processes
Run:
ps
Observe the processes associated with your current terminal.
Then run:
ps aux
Look at the USER, PID, %CPU, %MEM, and COMMAND columns where available.
Choose one process you recognise and note its PID and command name. Do not assume that an unfamiliar name is malicious.
Step 3: View live process activity
Run:
top
Observe the CPU and memory information and the process list.
Wait briefly and notice how the display updates. Press q to exit.
Step 4: Check memory usage
Run:
free -h
Record the reported total memory and available memory.
If swap is configured, observe its usage as well.
Remember that low free memory does not automatically mean the computer is running out of usable memory. The available estimate provides additional context.
Step 5: Inspect your current identity
Run:
whoami
id
These commands show your effective username and account/group identifiers. They help you understand the context in which your commands are being executed.
Step 6: Check service status if systemd is available
Try:
systemctl status
On a systemd system, this may display information about the system state. On some systems it may not provide useful output without a specific unit name.
If systemd is available and you know a suitable service unit on your system, inspect it using:
systemctl status UNIT_NAME
Replace UNIT_NAME with an actual service unit name documented or verified for your environment. Do not type the placeholder literally.
For example, cron or ssh may exist on some distributions, while others use different names.
If systemd is unavailable, record that fact and continue. You do not need to install or enable it for this exercise.
Step 7: Record your findings
Create a short lab report containing:
- The output or a summary of uptime.
- One process PID and its command name.
- The memory figures reported by free -h.
- One observation from top.
- Whether systemctl was available.
- One reason why unfamiliar processes should be investigated rather than immediately labelled malicious.
Do not include passwords, authentication tokens, or other sensitive information in your report.
Lab success criteria
You have completed the lab when you can:
- Explain what a process is.
- Identify a PID in process output.
- Distinguish an interactive foreground command from a background job.
- Explain what a service does.
- Inspect CPU and memory information.
- Interpret uptime and load averages at a basic level.
- Check service status where supported.
- Explain why observations require context before security conclusions are drawn.
PREVIOUS LESSON | NEXT LESSON